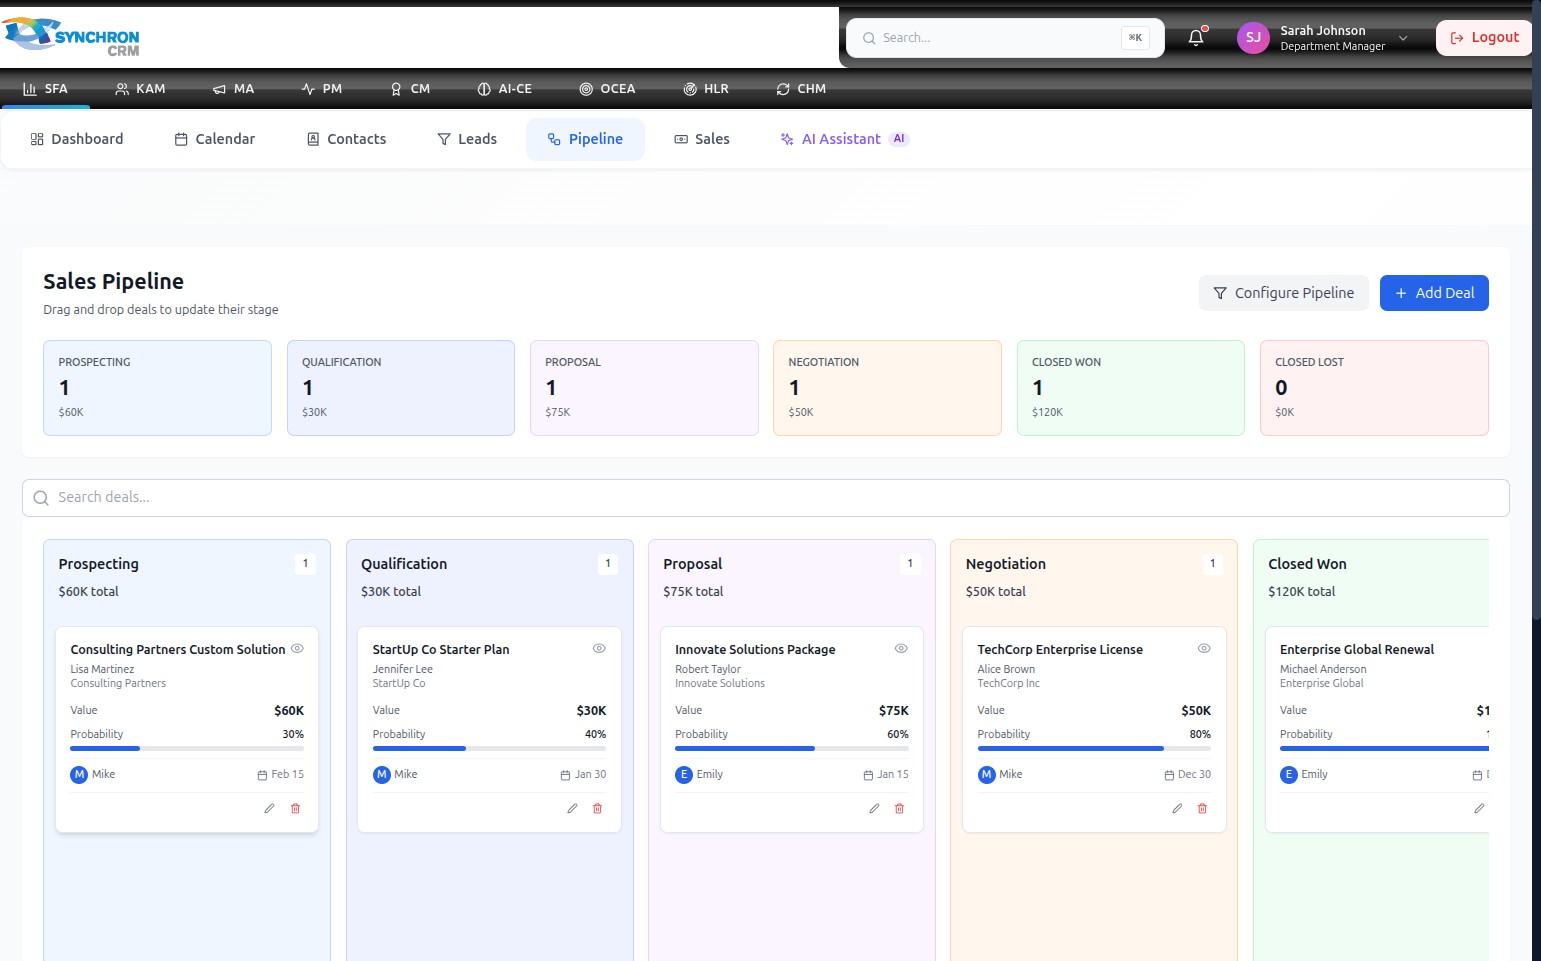
Sales Pipeline Overview
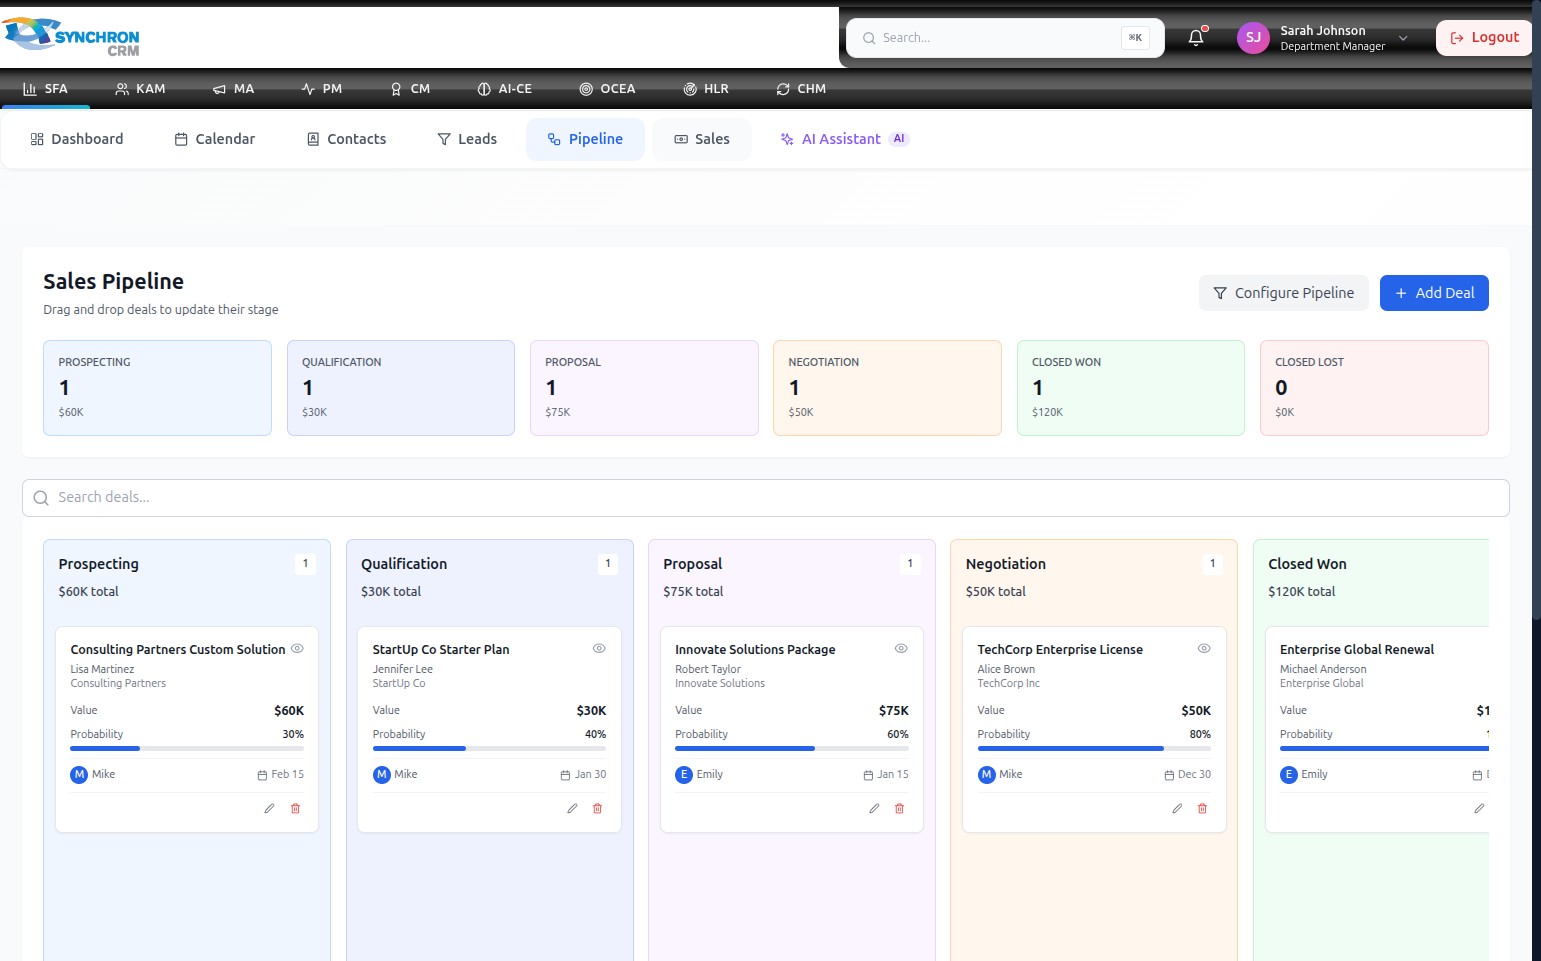
The Sales Pipeline displays all active deals organised by stage on a Kanban board. Use it to monitor deal values, probabilities, and assigned owners at a glance, and move deals between stages by dragging their cards.
Access the pipeline
Click the Pipeline tab in the secondary navigation menu (between Leads and Sales).
The board loads with all active deals grouped into their respective stage columns.
Understand the board layout
The summary bar at the top of the board shows the pipeline stages with their deal count and combined value:
| Stage | Description |
|---|---|
| Prospecting | Initial contact made, opportunity identified |
| Qualification | Determining whether the prospect is a good fit |
| Proposal | Quote or proposal submitted to the client |
| Negotiation | Terms and pricing are under active discussion |
| Closed Won | Deal successfully closed |
| Closed Lost | Deal was not won |
Below the summary bar, the same stages appear as vertical columns on the Kanban board.
Read a deal card
Each deal card inside a column contains the following information:
| Element | Description |
|---|---|
| Deal title | Name of the opportunity (e.g., "TechCorp Enterprise License") |
| Contact and company | Associated contact name and organisation |
| Value | Estimated deal value (e.g., $50K) |
| Probability bar | Blue progress bar showing the likelihood of closing (e.g., 80%) |
| Owner avatar | Initials of the assigned sales representative |
| Close date | Expected closing date (e.g., "Dec 30") |
| Edit icon ( ✏️ ) | Opens the Edit Deal form |
| Delete icon ( 🗑 ) | Removes the deal from the pipeline |
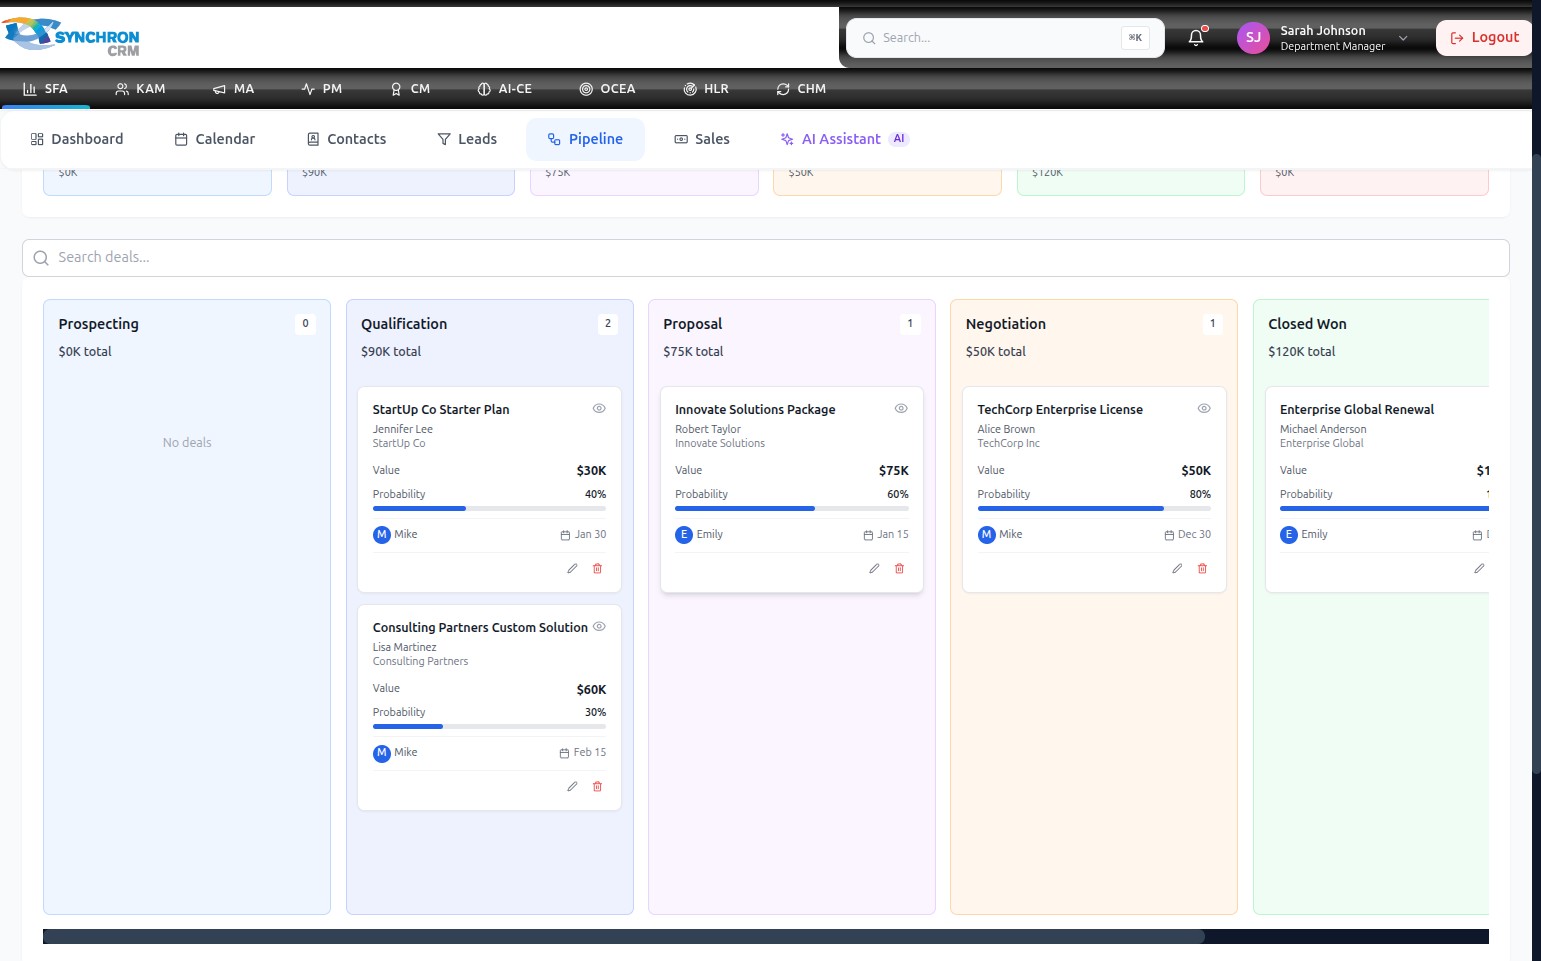
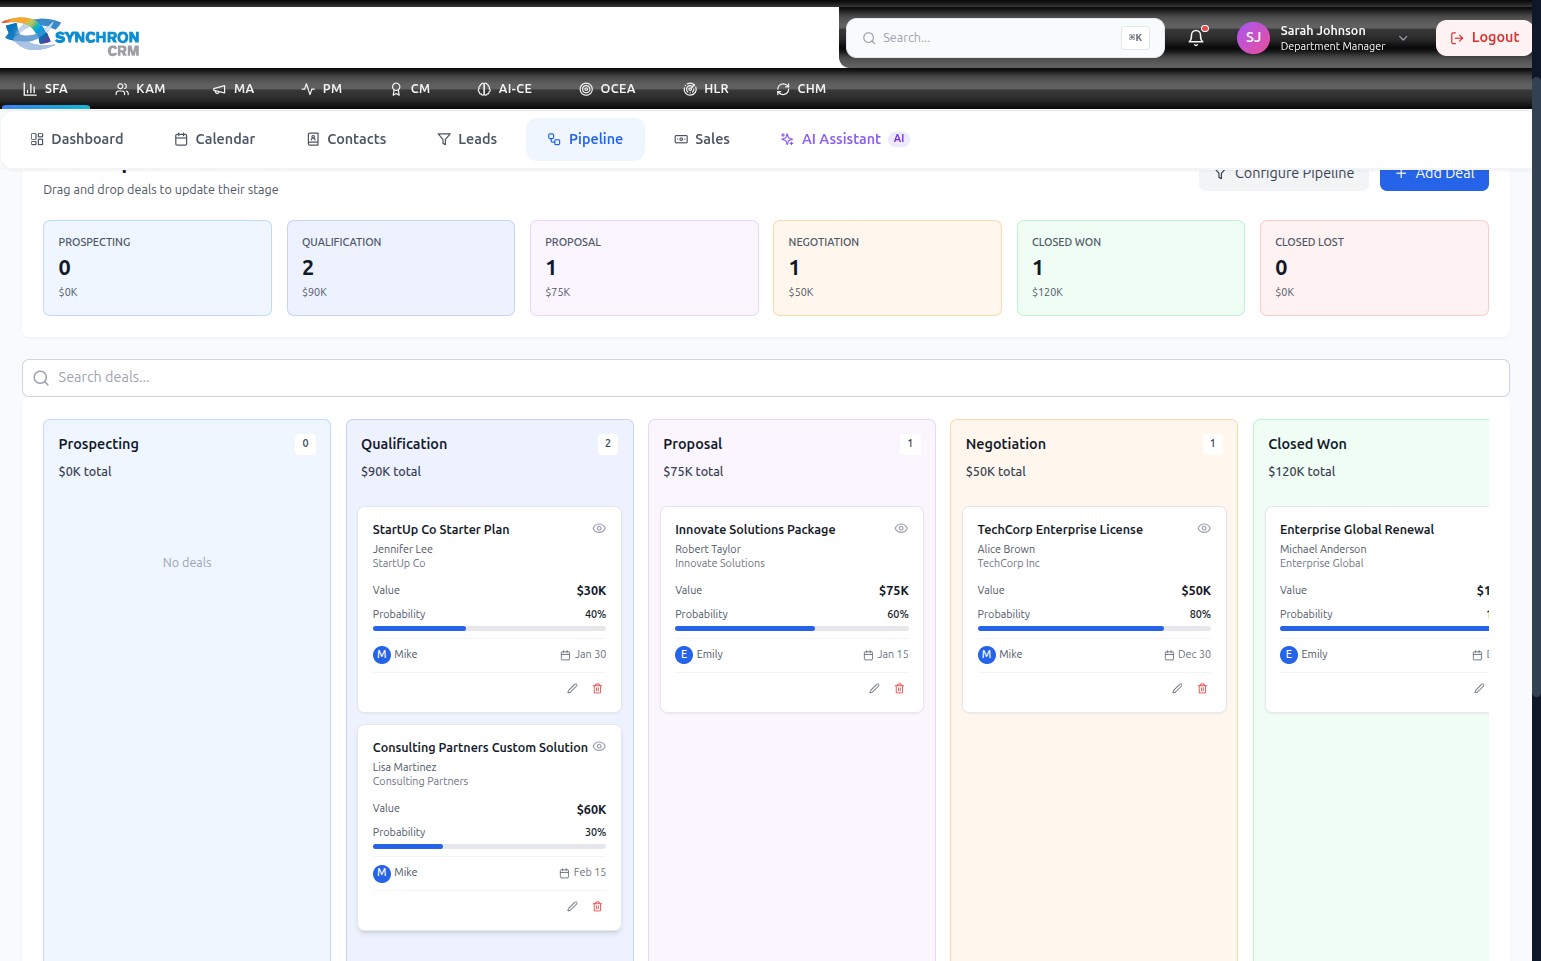
View all stages and deal distribution
The full pipeline board shows every active deal distributed across all stage columns:
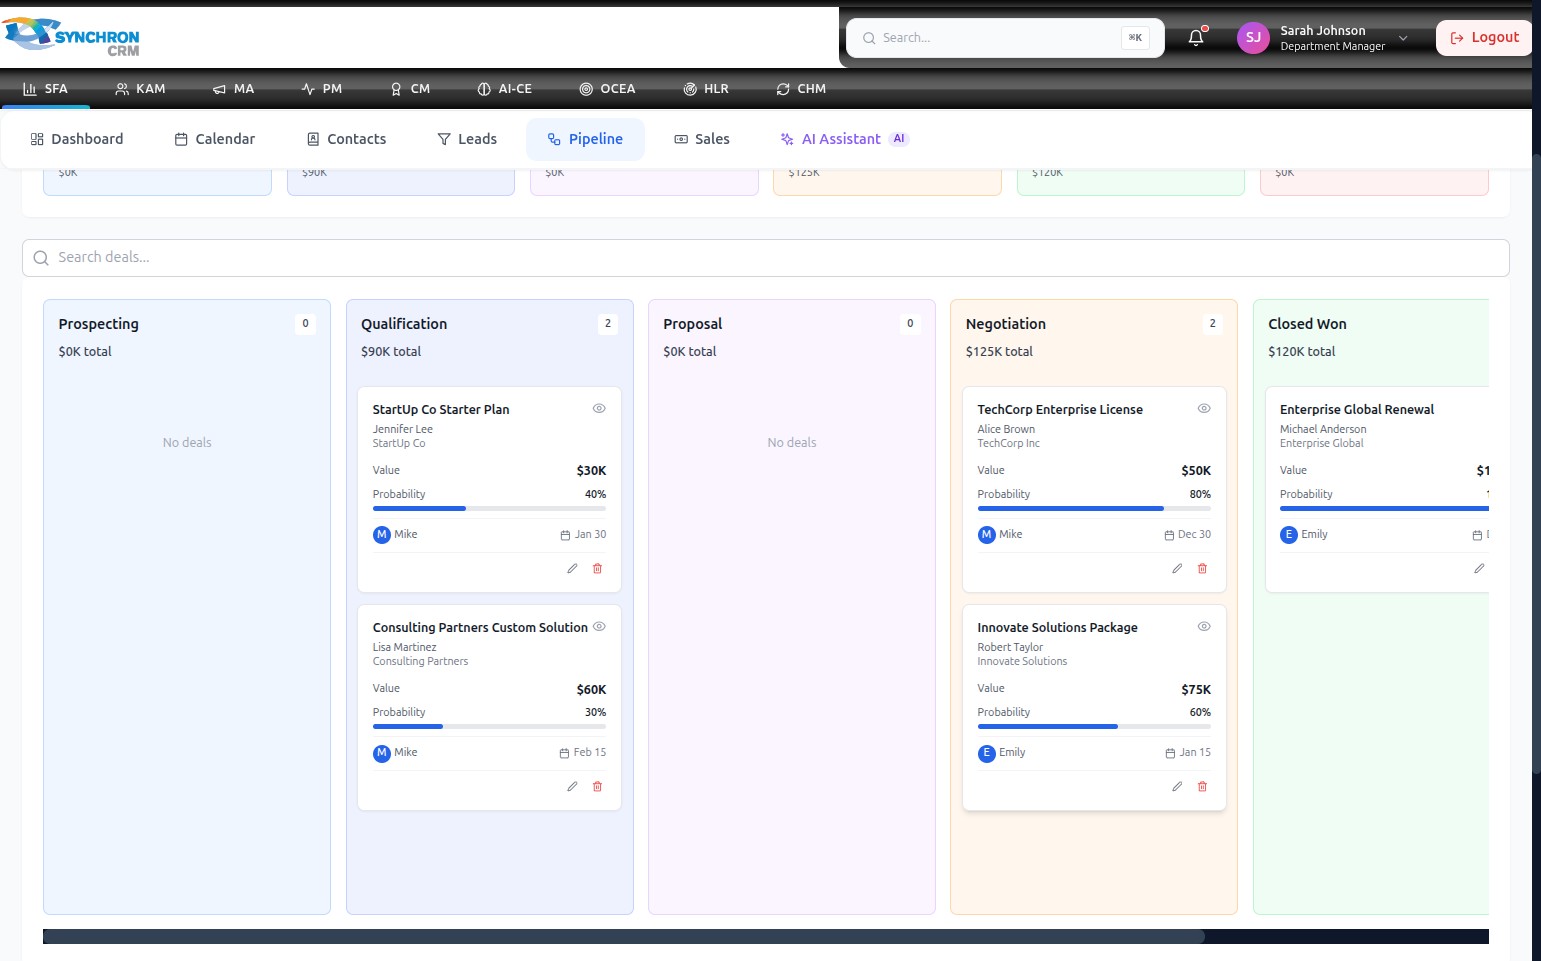
Use this view to assess whether deals are evenly distributed across the pipeline or concentrated at certain stages.
Update a deal's stage
Drag a deal card horizontally from its current column to the target stage column, then release. The stage summary totals at the top recalculate automatically.

When you drag and drop a deal card, the system updates the deal's stage immediately and recalculates the stage totals in the summary bar at the top.
Search for a deal
Type a deal name, contact name, or company into the "Search deals..." field above the board. The board filters to show only matching cards in real-time.

Use the pipeline controls
The top-right corner of the pipeline board contains the primary action controls:

- + Add Deal button — opens the New Deal form to add a new opportunity to the pipeline
- Configure Pipeline button (filter icon) — opens the pipeline stage configuration dialog
Review pipeline performance
The pipeline board provides an at-a-glance view of total deal value and deal count across all active stages:
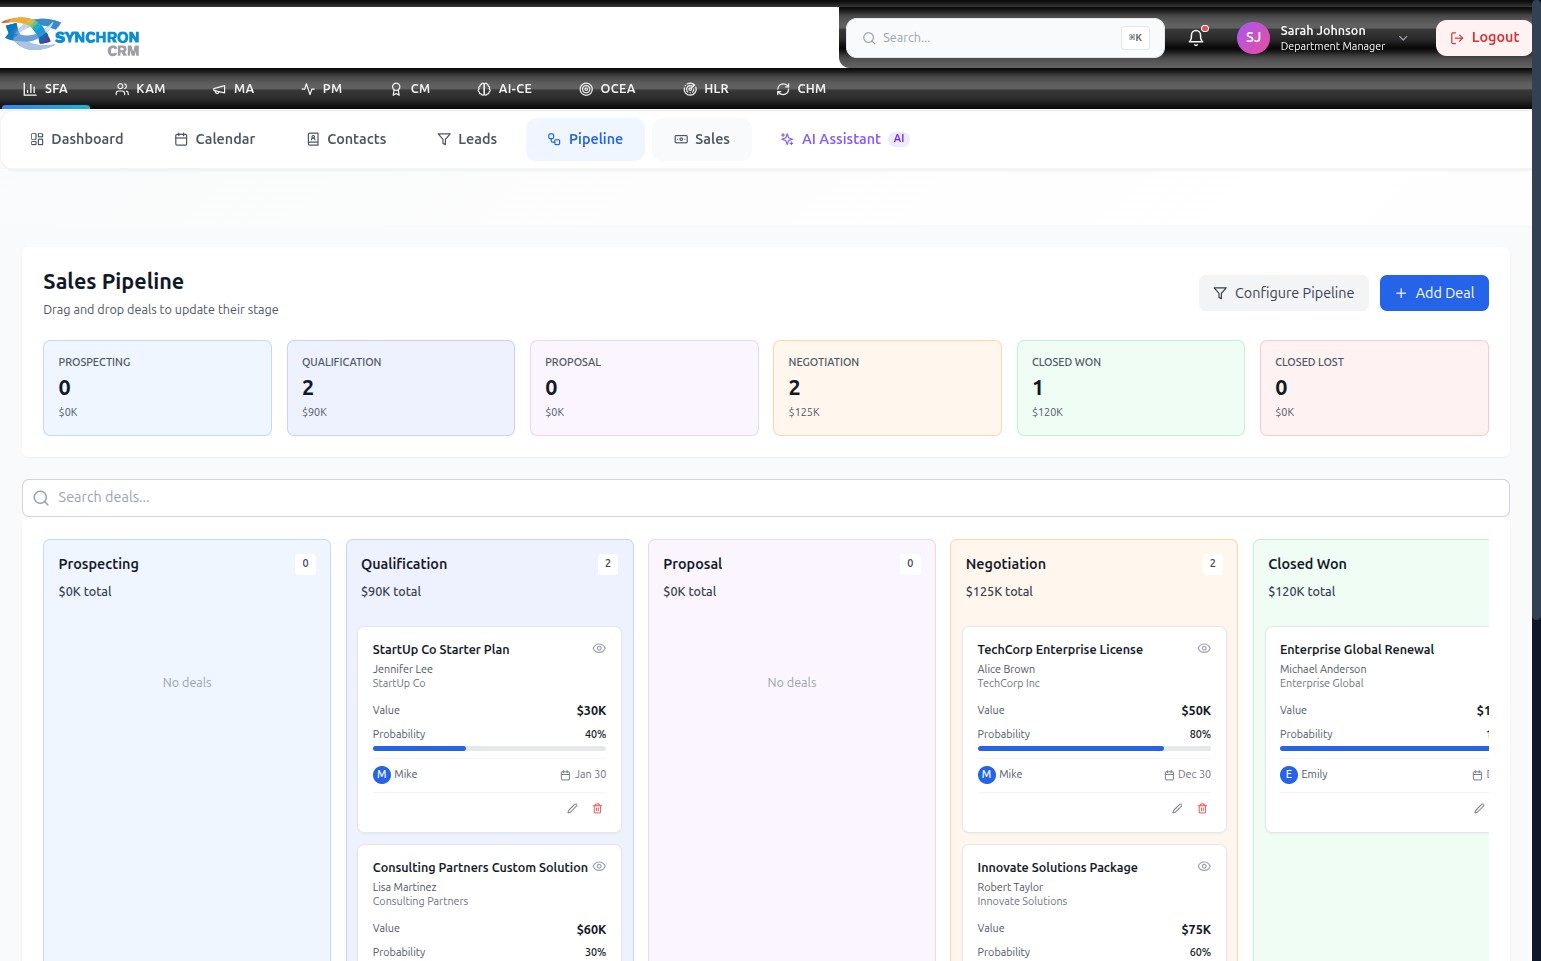
The summary bar at the top updates automatically whenever a deal is added, edited, moved, or deleted.
Edit or delete a deal
- Click the pencil icon on a deal card to open the Edit Deal modal and update its details. See Edit a Deal.
- Click the trash icon to delete the deal. This action is permanent.
Add a new deal
Click the blue + Add Deal button in the top-right corner to open the New Deal form. See Create a Deal for full instructions.
Configure pipeline stages
Click Configure Pipeline (filter icon, top-right) to add, edit, delete, or reorder pipeline stages. See Configure the Pipeline.
Use the colored probability bars to quickly identify high-priority deals. A longer bar (higher percentage) indicates a deal closer to closing; a shorter bar signals deals that need more attention or qualification work.