Dashboard Overview
The Dashboard is the central control panel of the SYNCHRON Sales Force Automation (SFA) system.
It provides real-time visibility into sales performance, pipeline health, and revenue tracking.
This page should be reviewed daily by all Sales Representatives and Managers.
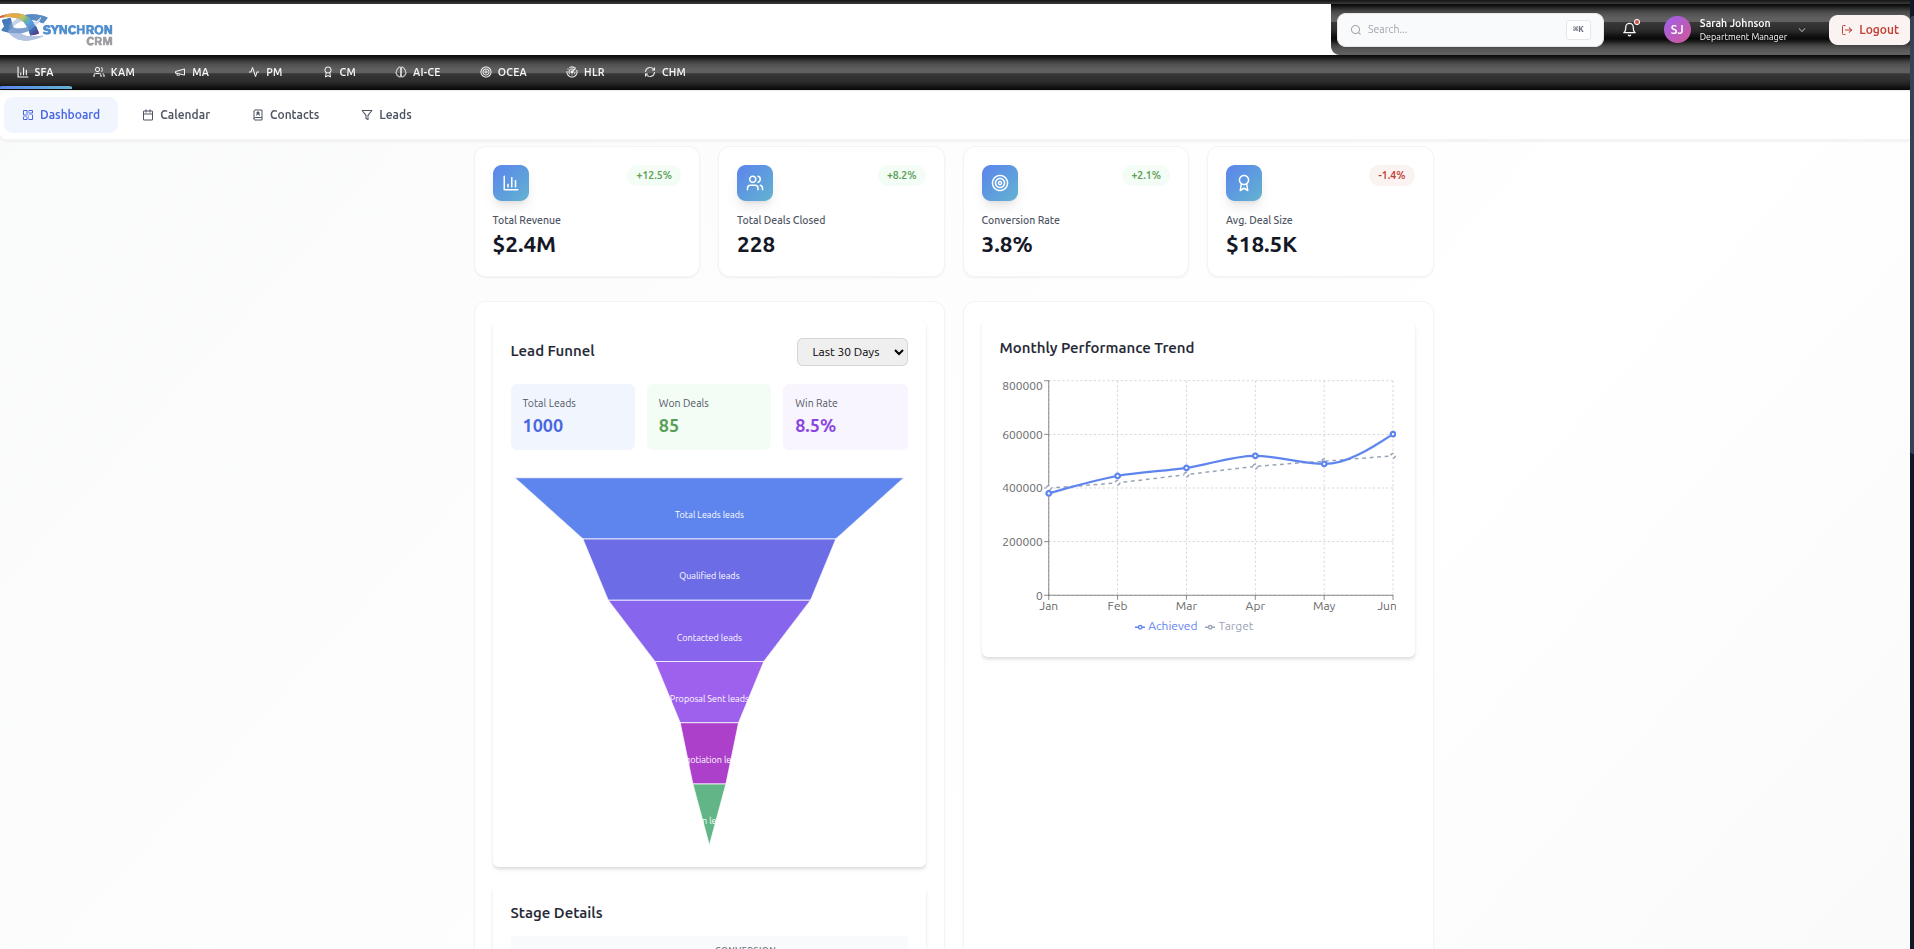
1. Dashboard Layout
The dashboard consists of:
- KPI Summary Cards (Top Section)
- Lead Funnel Visualization
- Revenue Performance Chart
- Time Filters & View Controls
2. KPI Summary Cards
The top section displays key performance indicators (KPIs).
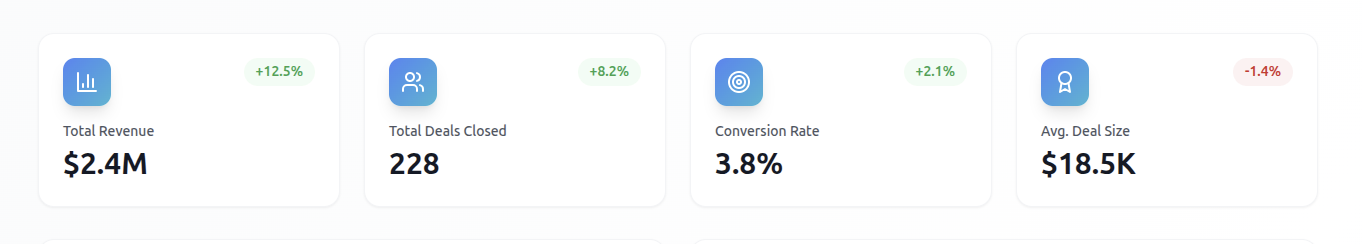
2.1 Total Revenue
Definition:
The total monetary value of all closed-won deals within the selected time period.
Why It Matters:
- Measures overall sales performance
- Indicates revenue growth or decline
- Used for target comparison
2.2 Deals Closed
Definition:
The number of successfully closed deals within the selected time period.
Why It Matters:
- Shows sales productivity
- Reflects pipeline effectiveness
- Helps identify closing efficiency
2.3 Conversion Rate
Definition:
The percentage of leads converted into closed deals.
Formula:
Conversion Rate = (Closed Deals ÷ Total Leads) × 100
Why It Matters:
- Indicates lead quality
- Reflects sales effectiveness
- Identifies process improvement areas
2.4 Average Deal Size
Definition:
The average revenue value per closed deal.
Formula:
Average Deal Size = Total Revenue ÷ Number of Closed Deals
Why It Matters:
- Identifies upselling opportunities
- Measures deal value growth
- Helps forecast revenue
3. Lead Funnel Visualization
The Lead Funnel shows how leads move through different stages of the sales process.
Funnel Stages May Include:
- Total Leads
- Qualified Leads
- Contacted Leads
- Proposal Sent
- Negotiation
- Closed Won
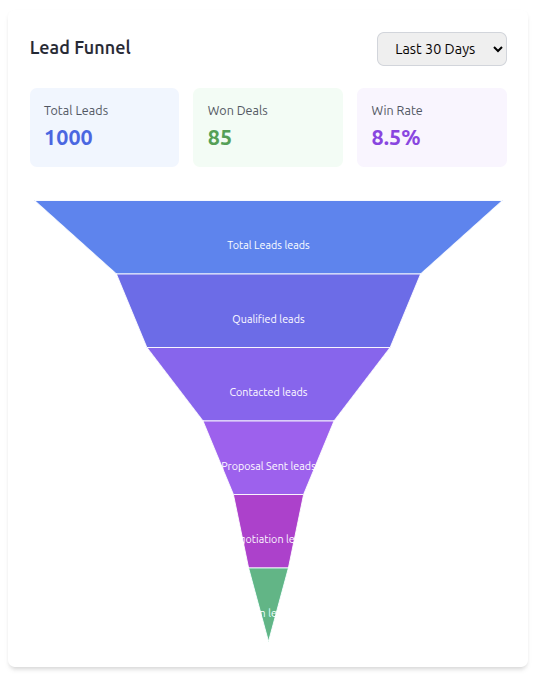
How to Use the Funnel
- Identify drop-off points
- Monitor stage conversion rates
- Focus on improving weak stages
Example Insight
If many leads are "Contacted" but few are "Qualified", qualification criteria may need improvement.
4. Revenue Performance Chart
The performance chart compares:
- Achieved Revenue
- Target Revenue
Displayed across selected time intervals (monthly, weekly, etc.)
Key Uses:
- Track progress toward sales targets
- Identify slow-performing months
- Support forecasting decisions
5. Time Filters & View Options
Users can filter dashboard data by:
- Last 7 Days
- Last 30 Days
- Monthly
- Quarterly
- Custom Date Range
Important:
Always verify the selected time range before analyzing performance.
6. Daily Dashboard Routine (For Sales Reps)
Every morning:
- Review revenue vs target
- Check conversion rate trend
- Review pipeline volume
- Identify deals close to closing
- Plan follow-up actions
7. Manager Usage
Managers should use the dashboard to:
- Compare team performance
- Identify underperforming reps
- Analyze conversion bottlenecks
- Adjust strategy based on revenue trends
8. Common Mistakes to Avoid
❌ Ignoring date filters
❌ Not updating CRM before checking KPIs
❌ Focusing only on revenue, ignoring conversion rate
❌ Keeping inactive deals in the pipeline
9. Best Practices
✔ Review dashboard daily
✔ Update leads before end of day
✔ Monitor conversion weekly
✔ Track revenue against targets consistently
✔ Use insights to improve sales strategy
10. Summary
The Dashboard is not just a reporting tool.
It is a decision-making tool that helps:
- Sales Representatives improve performance
- Managers optimize team output
- The organization drive revenue growth
Always treat the Dashboard as your primary performance control center.